Twelve months after the introduction of the lockout laws that stop patrons from entering a venue after 1:30am and the end of service of drinks at 3:00am has began to point to harder evidence of where violence has decreased and perhaps more interestingly where it has increased.
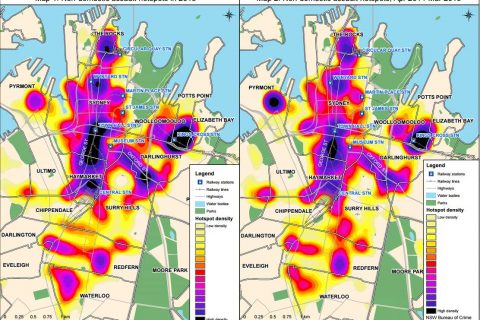
A heat map overview of Sydney has been released by the NSW Bureau of Crime Statistics and Research after a full year of data collection that pinpoints assault hotspots that have unsurprisingly moved outside of previously maintained entertainment sectors.
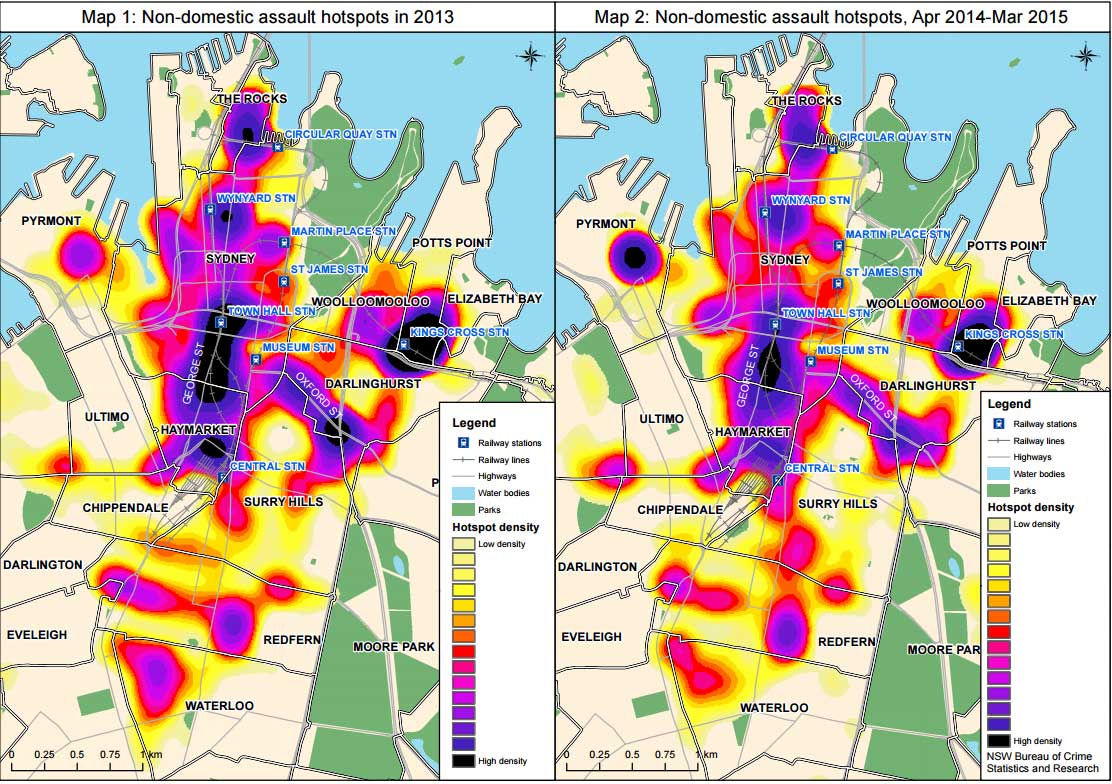
After a brief look we can tell the following has happened over the last year since the introduction of the lockout laws.
- Kings Cross and surrounding suburbs still have instances of violent altercations, although slightly down
- Redfern, Waterloo and Surry Hills have seen an increase in violence although the NSW Government said this wouldn’t happen to surrounding suburbs outside of the lockout laws (and possibly a prediction for Newtown)
- Pyrmont has seen a very noticeable increase in violent assaults, our guess due to The Stars exclusion from the lockout laws
With venues in Newtown now implementing a self-imposed 3am lockout it’ll be interesting to see if the trend continues through the inner-west.
More than ever it’s time to support these venues throughout Sydney and work with them through the testing times for our right to enjoy the nightlife.
source: Sydney Morning Herald


Comments